VIEW DEMO (source code – d3 and svg prototype used for Angular 2 app; source code – dynamically load d3 chart with json data)
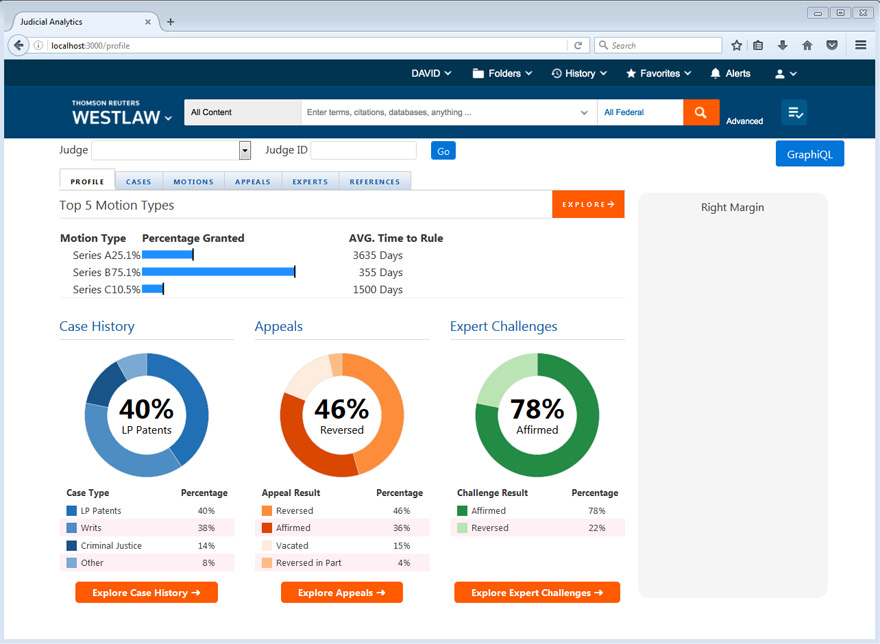
I have created more charts than the number of fingers I have. I have also created various charts using different technologies and libraries. This time, I get to dabble in Angular 2 and create charts using SVG and Javascript. It’s more time consuming to create SVG charts, but you do get more flexibility to make charts that don’t exist in any of the other charting frameworks.
